
GARIM WORLD EQUITY a 30 DE NOVIEMBRE de 2022

La rentabilidad de GARIM WORLD EQUITY en el mes noviembre 2022 es +4,6%. En el mes, el índice S&P500 tuvo una rentabilidad +5,4% y el EuroStoxx50 +9,6%. La rentabilidad de GARIM WORLD EQUITYen el año en curso es de -22,5%. La rentabilidad en el año 2021 fue +20,0% y la rentabilidad en el año 2020 fue +13,7%. Las mejores contribuciones al resultado provienen de On Semiconductor, Broadcom, Deere, Alphabet, Microsoft o Novo Nordisk. Tenemos una posición en liquidez del 10,6%.
The return of GARIM WORLD EQUITY in the month of November 2022 is +4.6%. In the month, the S&P500 index return was +5.4% and the EuroStoxx50 +9.6%. GARIM WORLD EUITY profitability in the current year is -22.5%. The profitability in the year 2021 was +20.0% and the profitability in the year 2020 was +13.7%. The best contributions to the result come from On Semiconductor, Broadcom, Deere, Alphabet, Microsoft o Novo Nordisk. We have a cash position of 10.6%
ArtículosRelacionados
Artículos relacionados-
NOTA 30 ABRIL 2020 – GARIM WORLD EQUITY
-

Informe mensual de mercados y carteras asesoradas Mayo 2024
-
NOTA 8 DE JUNIO 2020 – GARIM WORLD EQUITY
-
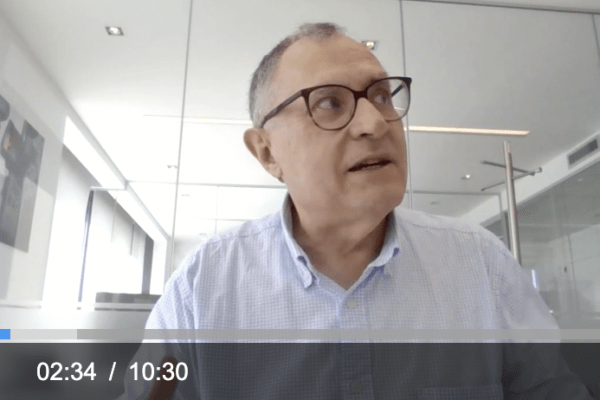
Alfonso (Norz Patrimonia): «Potenciamos la combinación de asesoaramiento e inversión»
-

Webinar. Reflexiones y perspectivas de mercado 2022.
-

GARIM WORLD EQUITY – NOTA 30 JUNIO 2020
-

GARIM WORLD EQUITY a 31 DE AGOSTO 2022